24 mo.Usage Graph - new?

I just ran across this “report” or Graph and I have to say I like it! First off, is it new? I don’t recall this in the past versions…

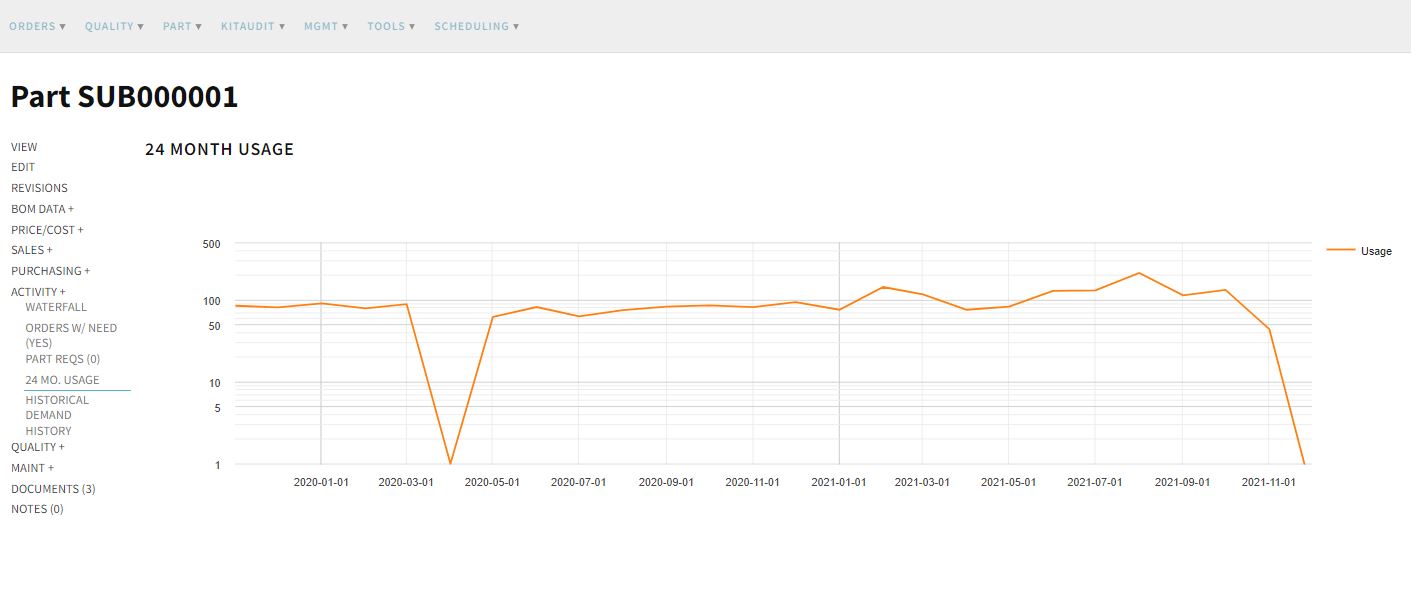
Can you provide a bit more insight as to the how it’s calculating it’s values?
Is there a report or a place I can go to export the data that’s shown in the graph?

Hi Regis,

Yes sir! This is a new report. The 24th Month Usage is the total number of parts either consumed on a job (upper assembly) or directly shipped.

It’s effectively the invoice list (showing intercompany = All). However, this is just grouped visually to see the usage in a consumable graph.

Best,
The Cetec Team

Nice. I like it. Would it be possible to have an optional selection for differentiating intercompany values? Looking at the internal consumption (production) vs the external (sales) would make it a tad more useful to the specific groups…