Using the Ontime Ship Report page, We compare the Ship Target to the Invoice Date to determine if shipments are being sent out on time.
Can you confirm that if the “ship target” date doesn’t match exactly the Invoice/Ship date, then it would NOT be considered “On-Time”? Even if the Invoice date is “before” the ship date?
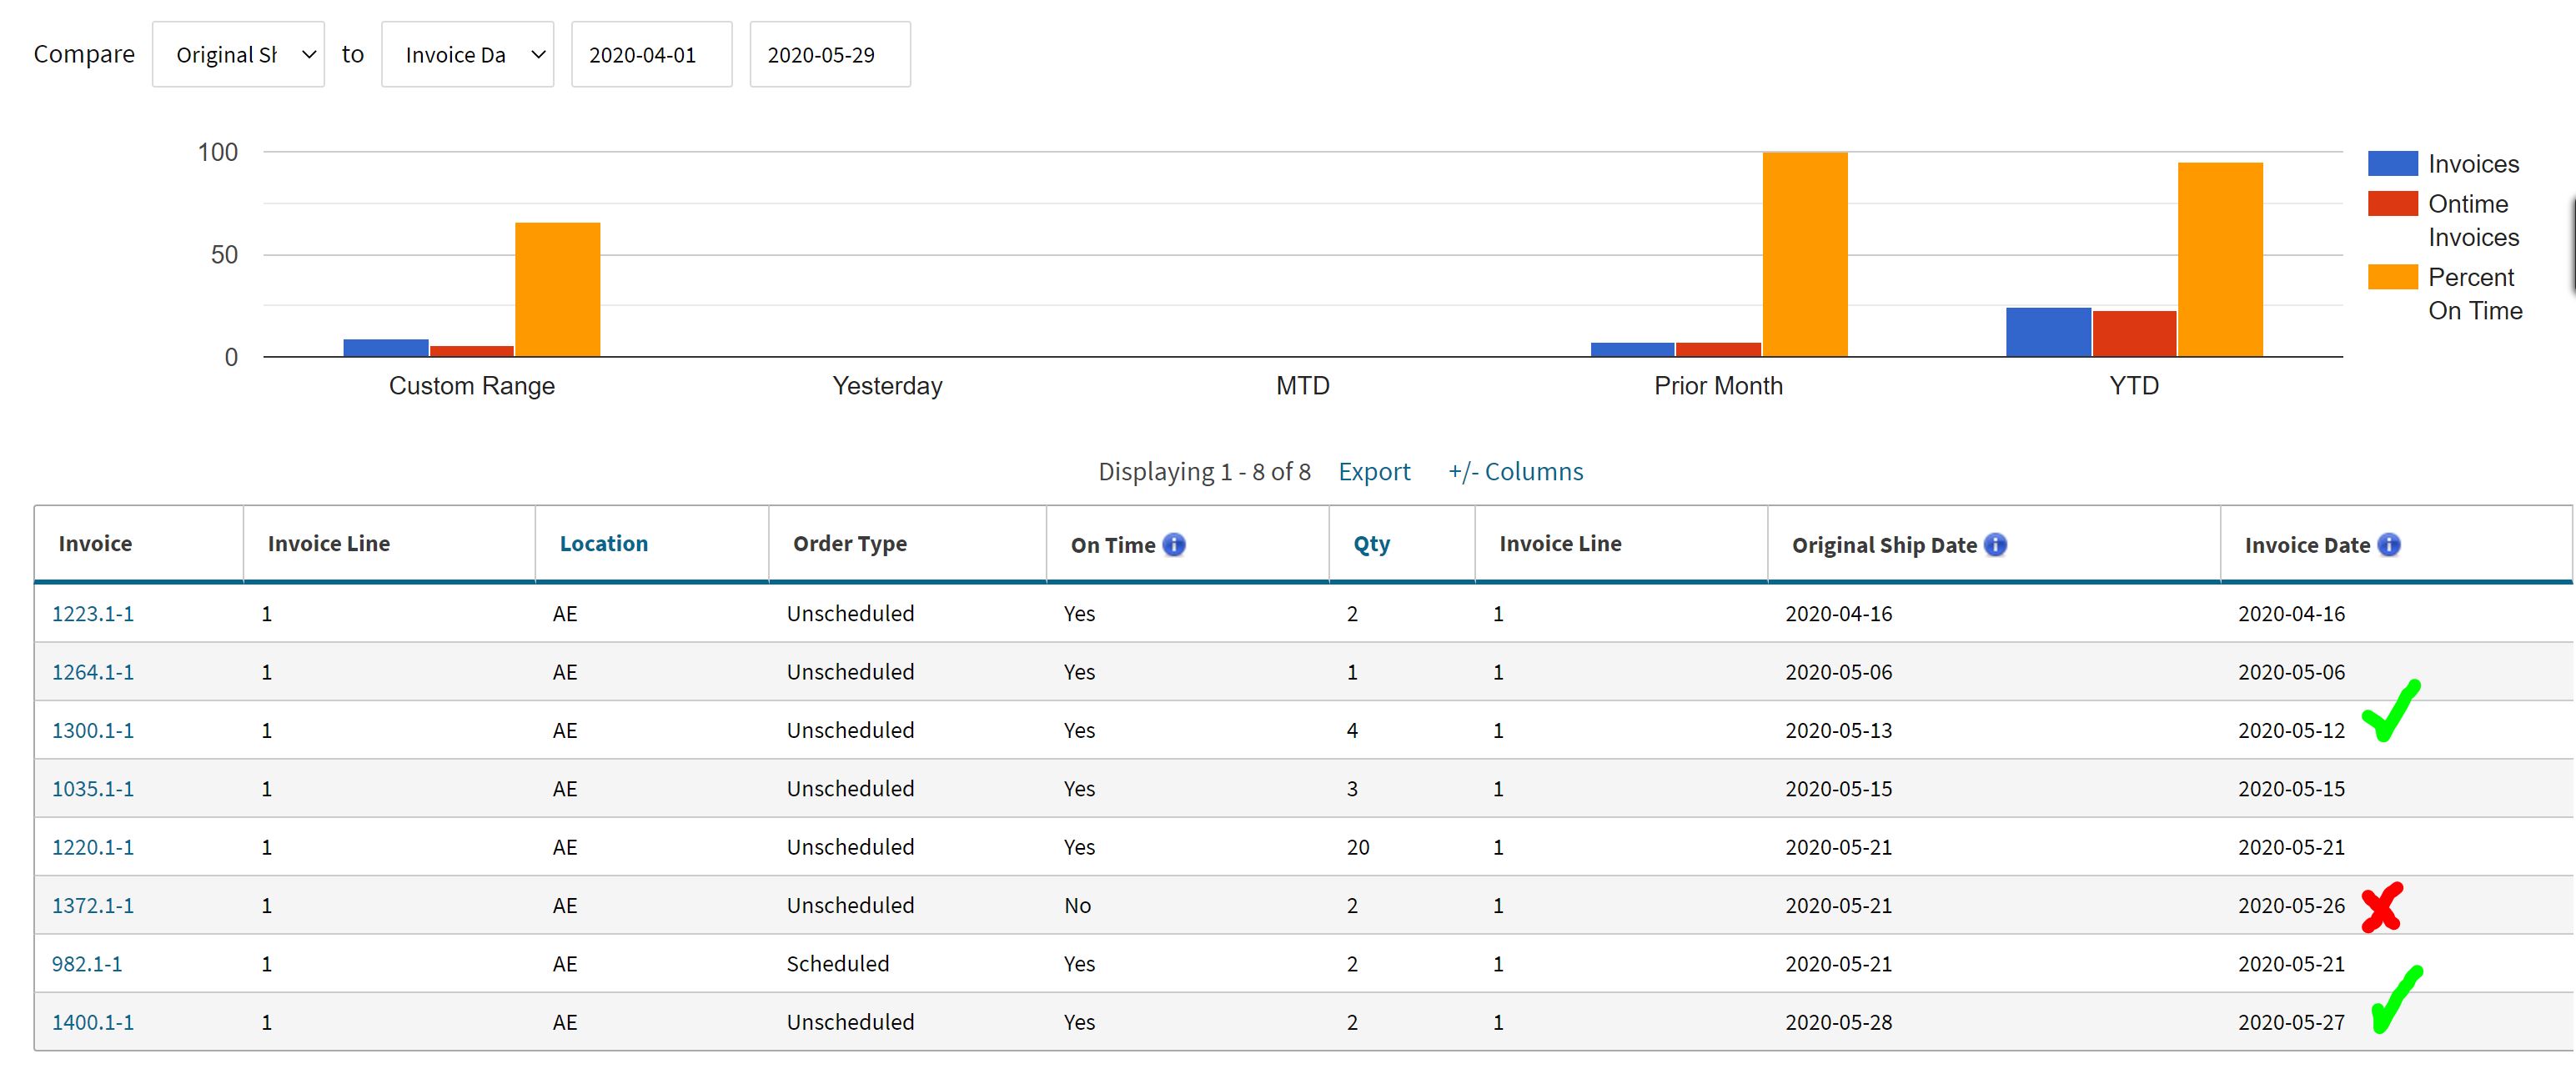
In the screenshot below, I have 8 records, and only 1 of the records shows a “late shipment” date. - Red Check.
I have 2 records showing delivery/invoice occurred prior to “original ship date”. Unfortunately, it seems as if this counts against our metrics.
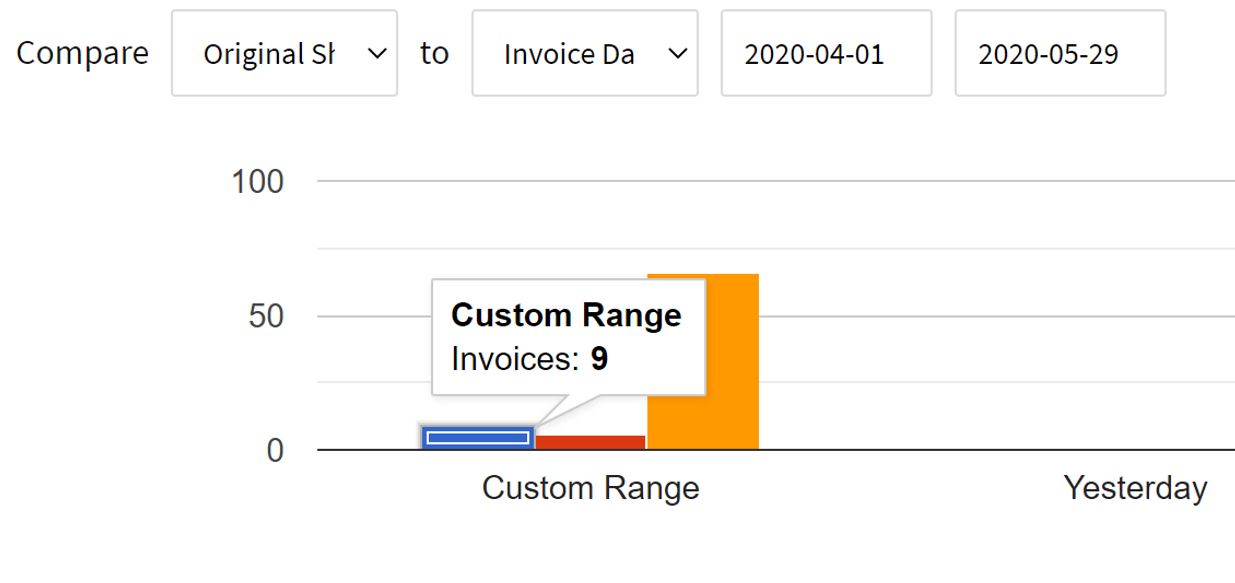
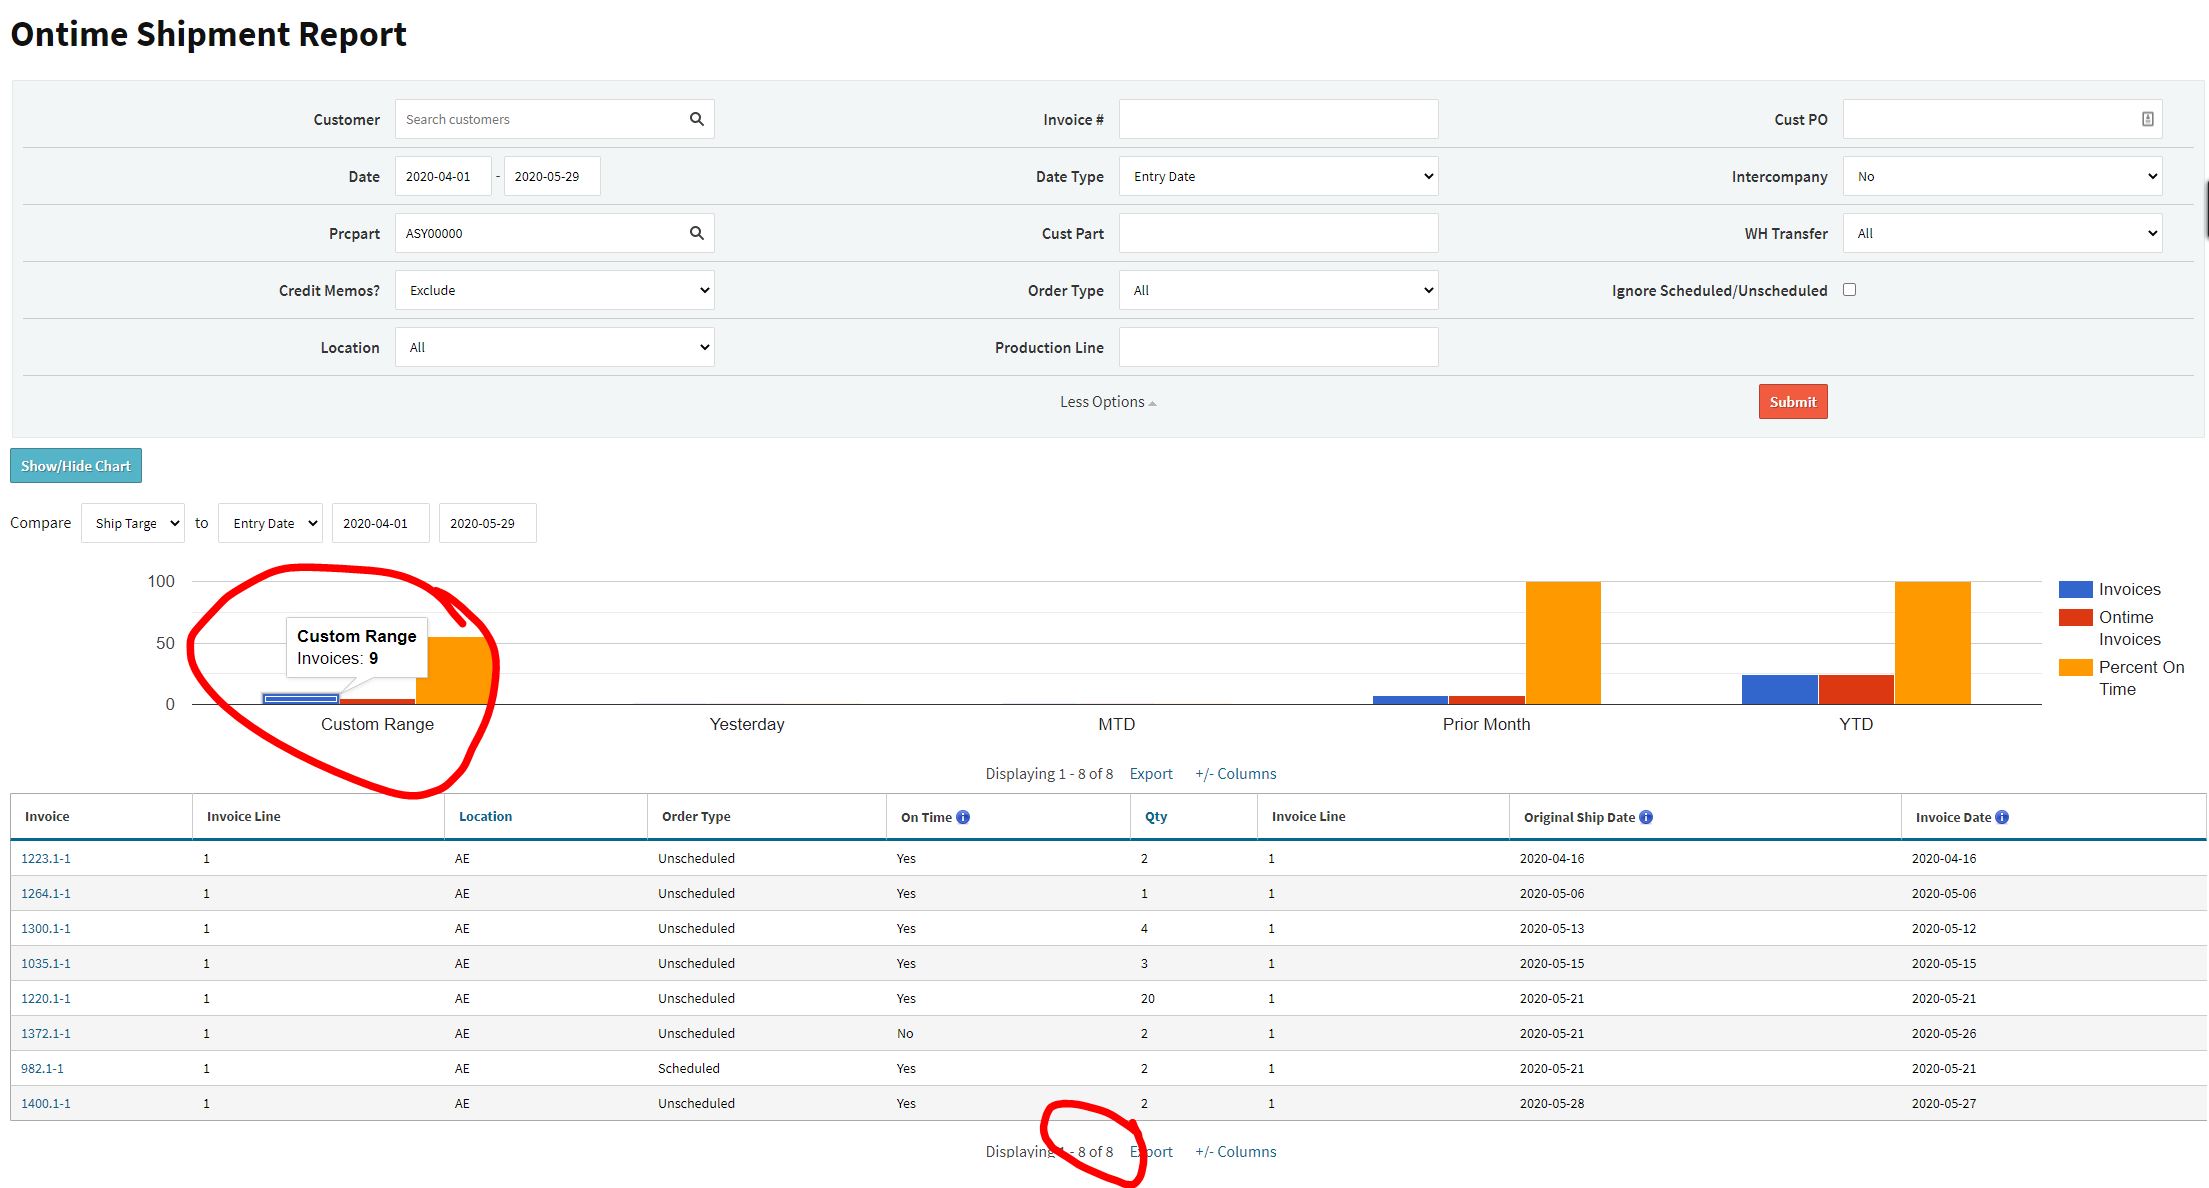
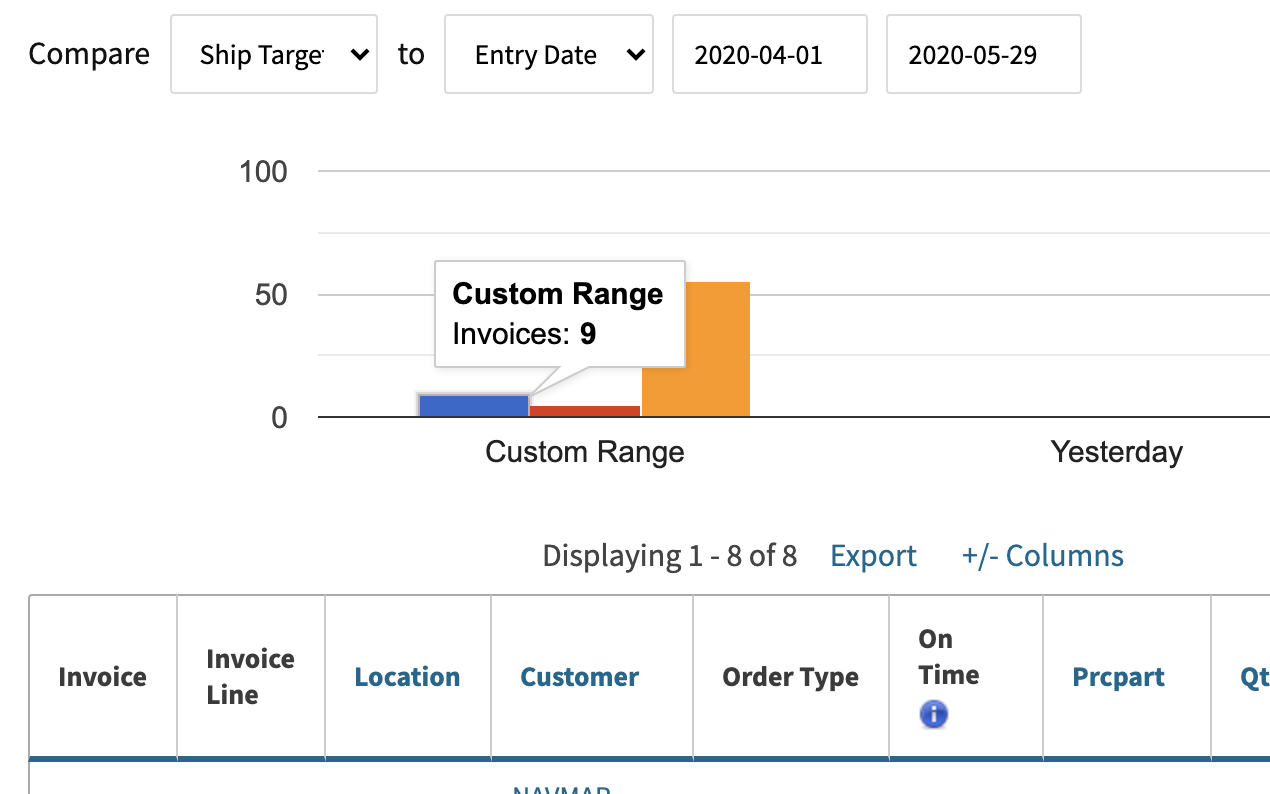
Also, i’m noticing that there is always N+1 records on the chart… compared to what i see on the list…Why would this be? For example, I see 8 invoices on this list, but the chart shows 9?
You are correct, on this report on time means exactly the same as the date. Any ship date before or after the target will show as not on time. In other words, on time = shipped on original ship date, on time ≠ not late.
We’ll have to investigate this for you, does seem weird that it would always be showing 1 more in the graph there than what’s being shown on the report.
To clarify this a bit further, specifically the report is looking for orders that are both scheduled and shipped that exact date. If you go to your filters and click more options, there’s a checkbox to ignore the scheduling aspect, and that would make this report function more like what you might expect, where anything shipped on or before that date is on time and anything late is no on time.
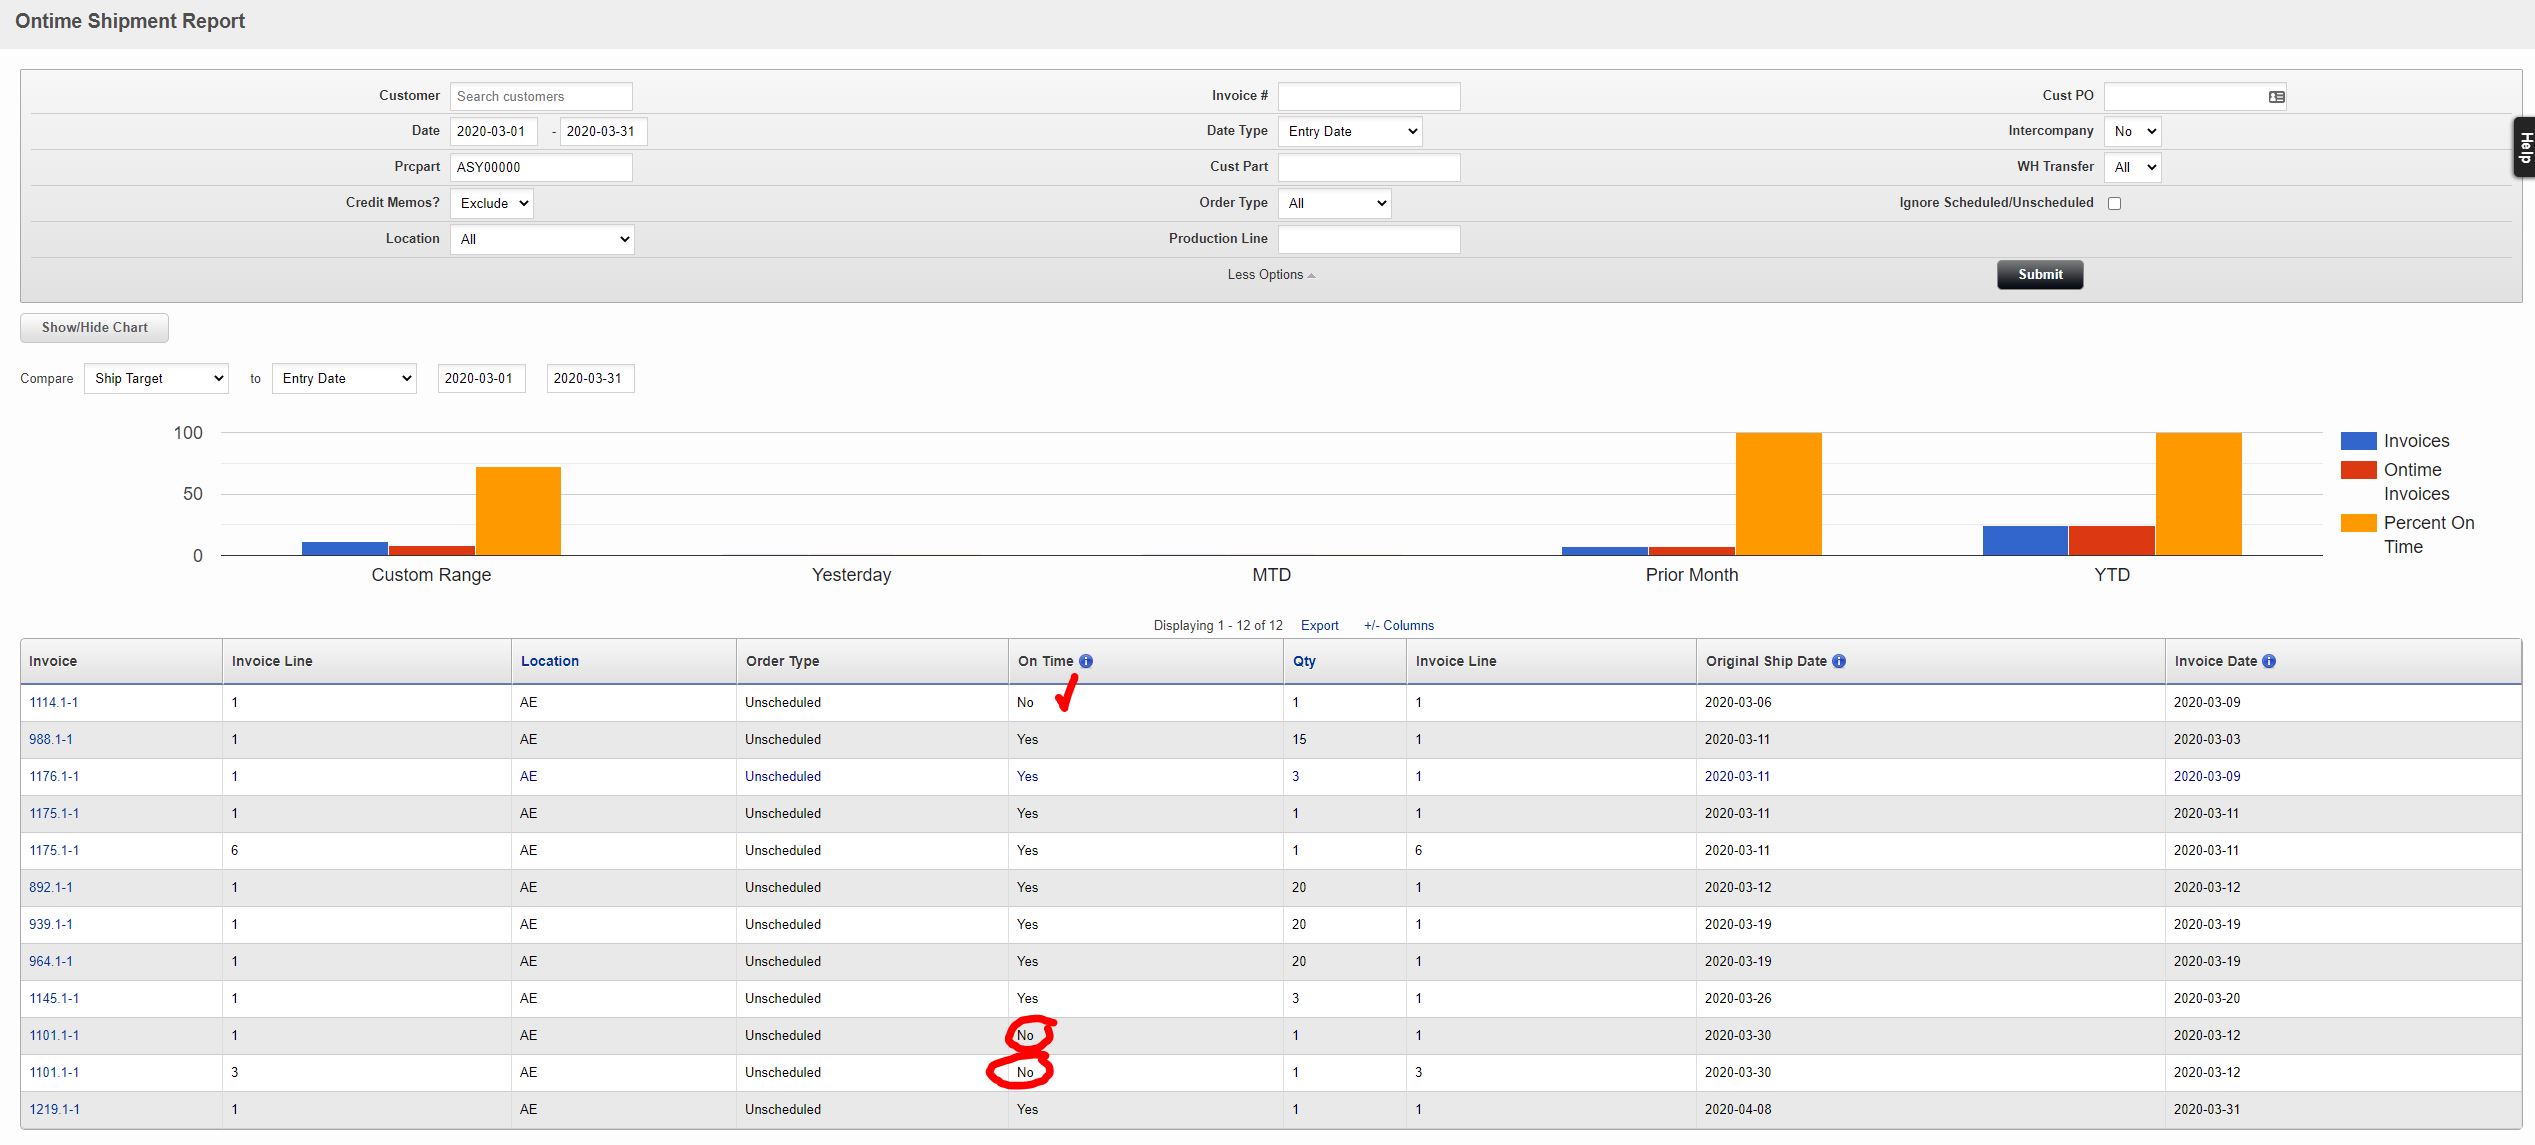
I have this invoice 1101.1 in which we put the original ship date as 3/30/2020. the order was set as “unscheduled” and we actually shipped/invoiced it 3/12/2020, a few weeks early. This is showing up in the OTD Chart and report as NOT on-time and counts against our OTD metrics.
Can you give us an example of what filters you were using that’s showing the n+1 number of invoices on the graph for you? We’re not seeing that same issue when we look at your environment, so we just want to make sure we’re using the same filtering.
By default it’s comparing Ship Target to entry date, where the list below in your example is only using entry date. So it’s just a fringe situation where in the specified date range you may have a different number of invoices that are supposed to ship than were entered. In your example here, you can actually see that 9th invoice if you switch the date type above to ship target. Or, you can change the date type on the graph to something besides ship target and it will recalculate using the new date type, and the rest only show the 8 total invoices.