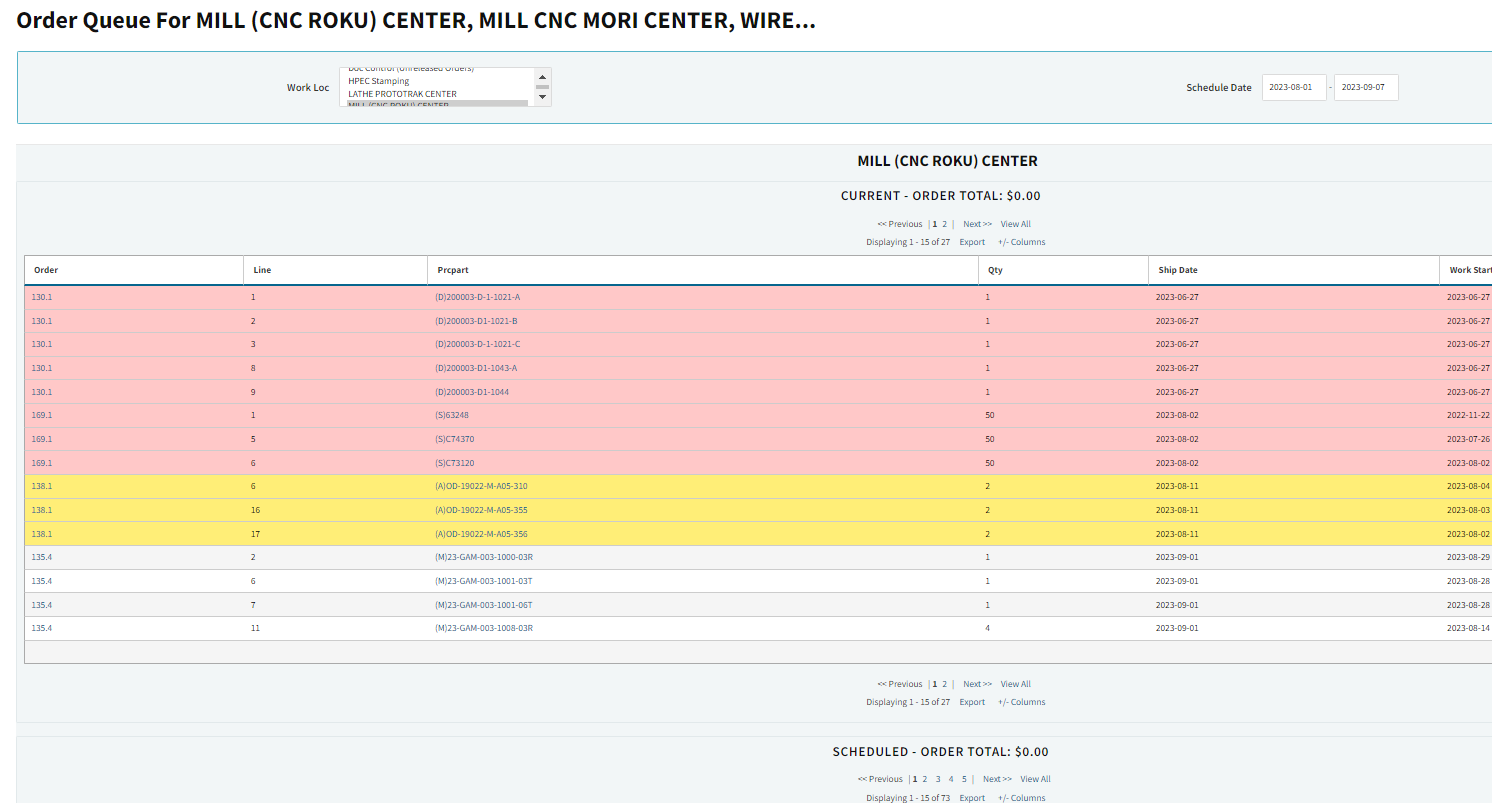
I’m trying to use features that will help me “See the shop”. I’d like to be able to tell if a location is at capacity or how much availability the shop has. I was looking at Order queue and i’m not sure what the diffference is between scheduled and current. I looked at an order from each section 130 and 144, each had time already and each was scheduled.
I’m going to reference a few terms/items with this white paper as background (Executive Overview_ Scheduling & Capacity Forecasting.pdf - Google Drive)
Your question: “tell if a location is at capacity or how much availability the shop has” … we do have this kind of view in Cetec ERP when using the “Schedule By Production Line” mode.
When scheduling at the more granular “Schedule By Work Location” mode, the gantt chart produced in that mode can by run in “View By Work Location”. This shows the demand of production scheduled into each work location over time (the “bars” you see on the gantt chart are the demand). Each “bar”, when you hover over it, shows how that demand is consuming against available capacity.
That’s all that is currently supported in the base/lite Cetec plan.
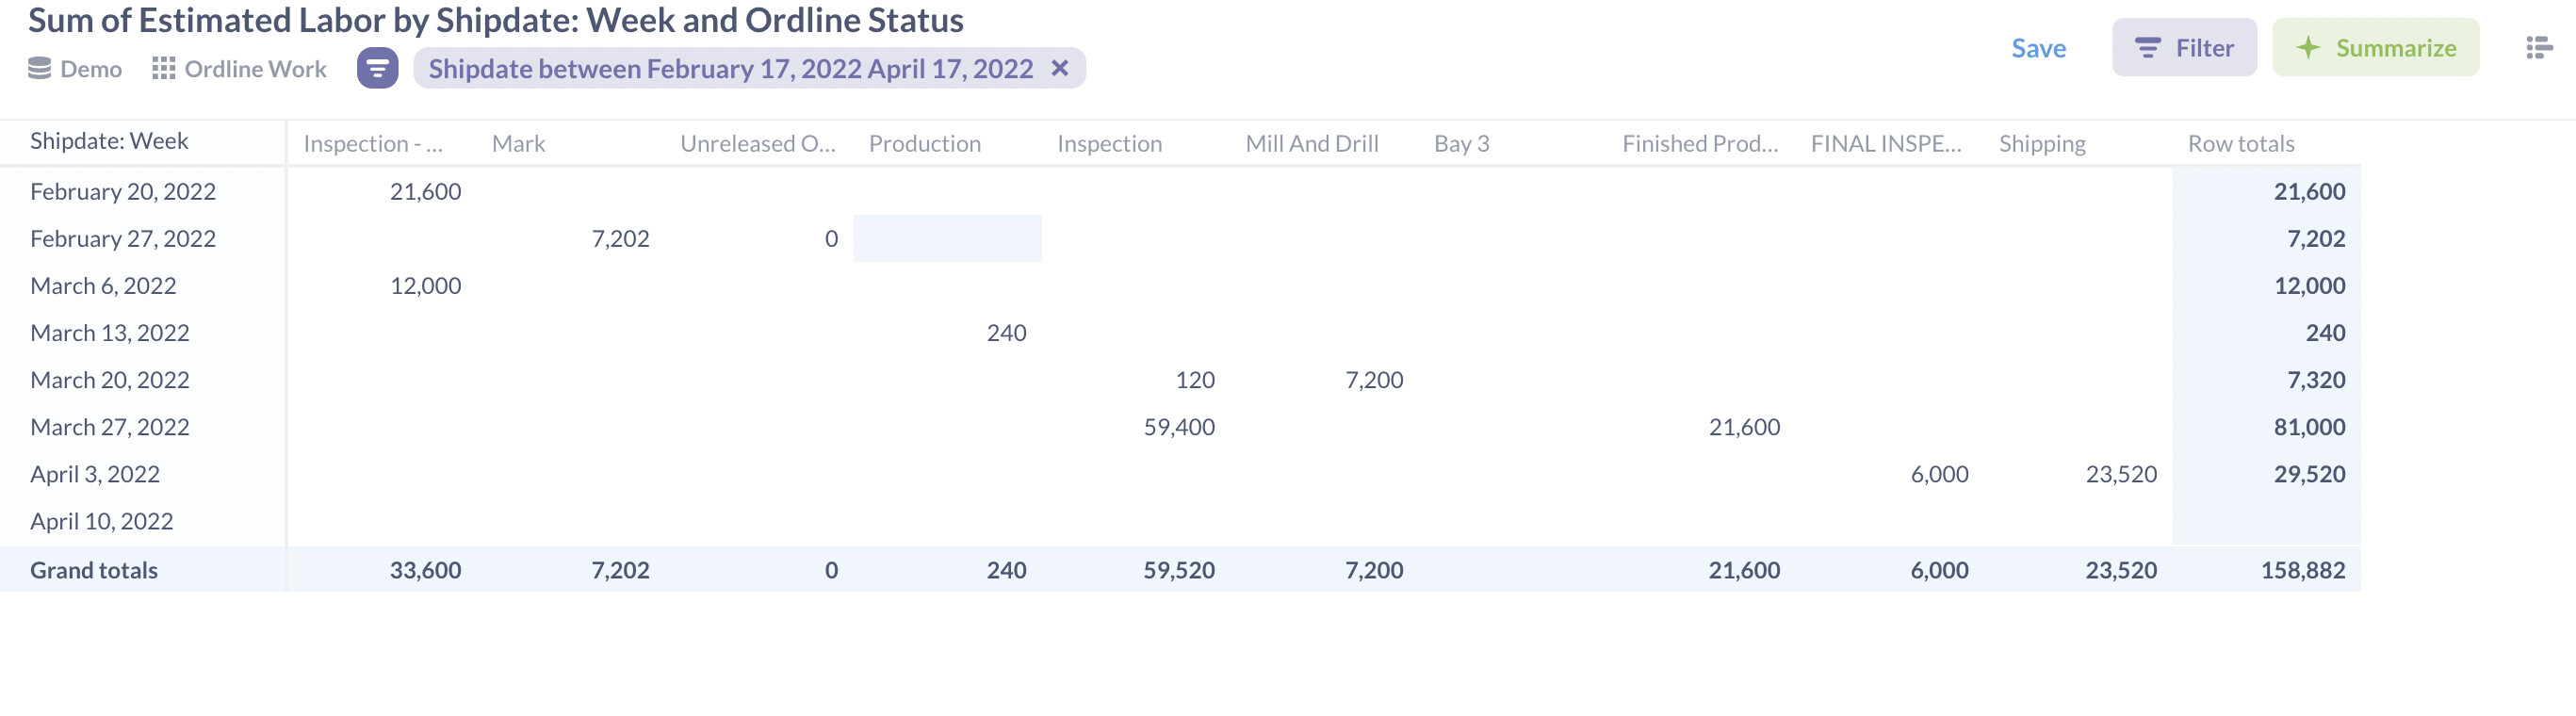
It may be that you are looking for a different report or angle of looking at the data that isn’t available in a base Cetec report yet. For instance, there are different things you can do with scheduling data using the Cetec ERP BI (custom reporting) engine. For example, I’ve just taken 5-10 minutes and created a few reports, I’ll spell them out below.
Here are a few visuals of work location estimated labor grouped by date and by work location.
Then, you could easily update the date bucket to pivot that table on, as so:
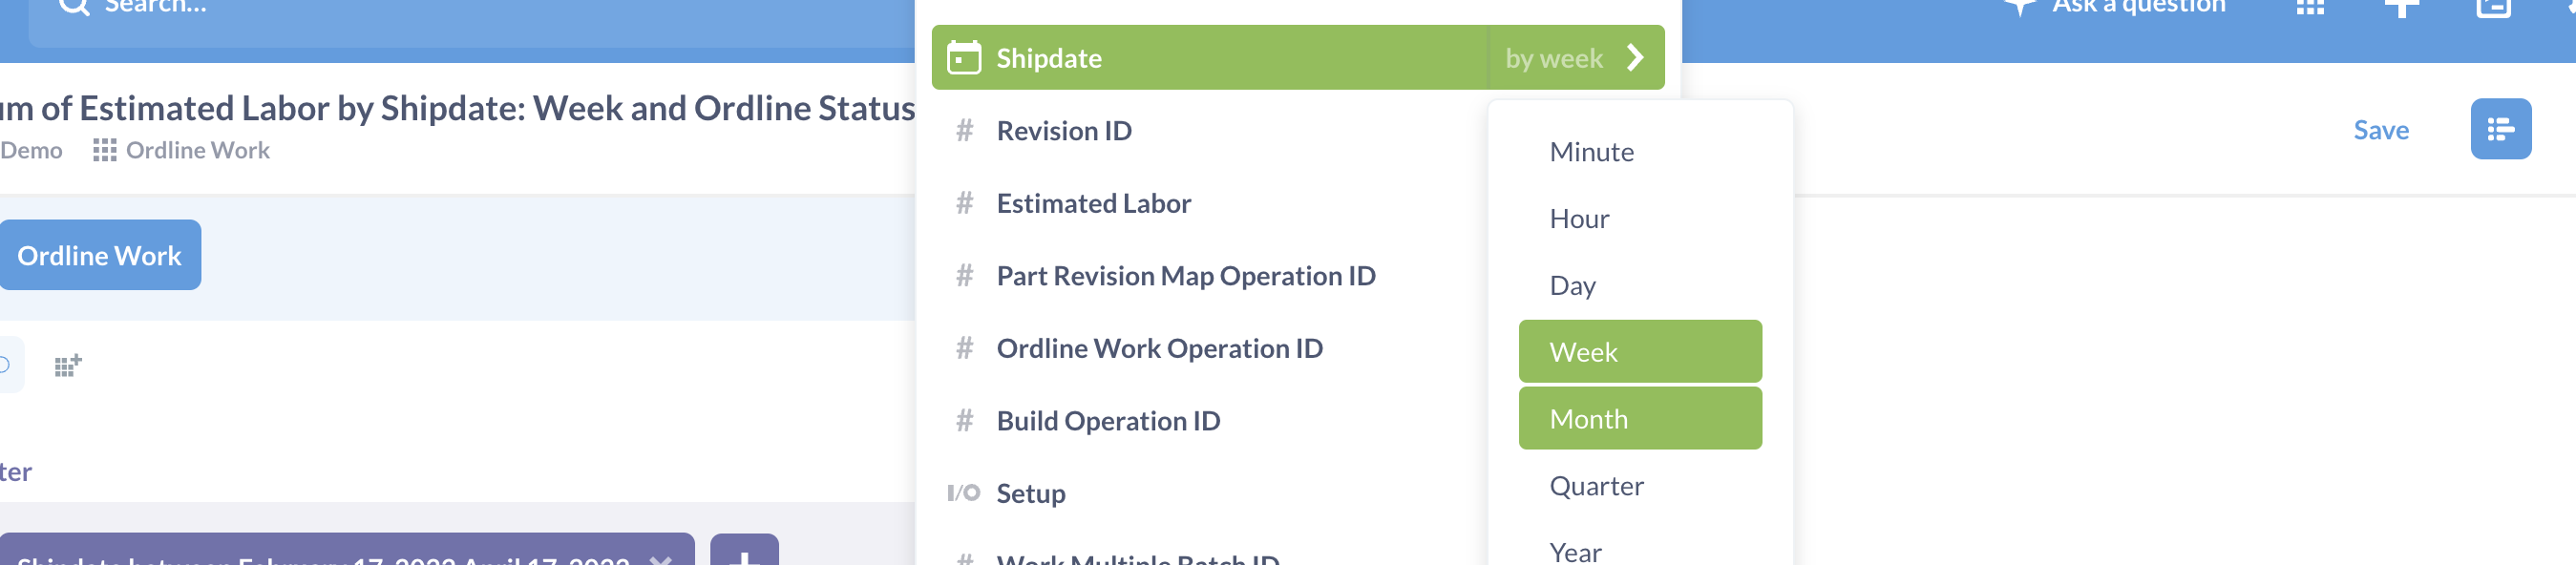
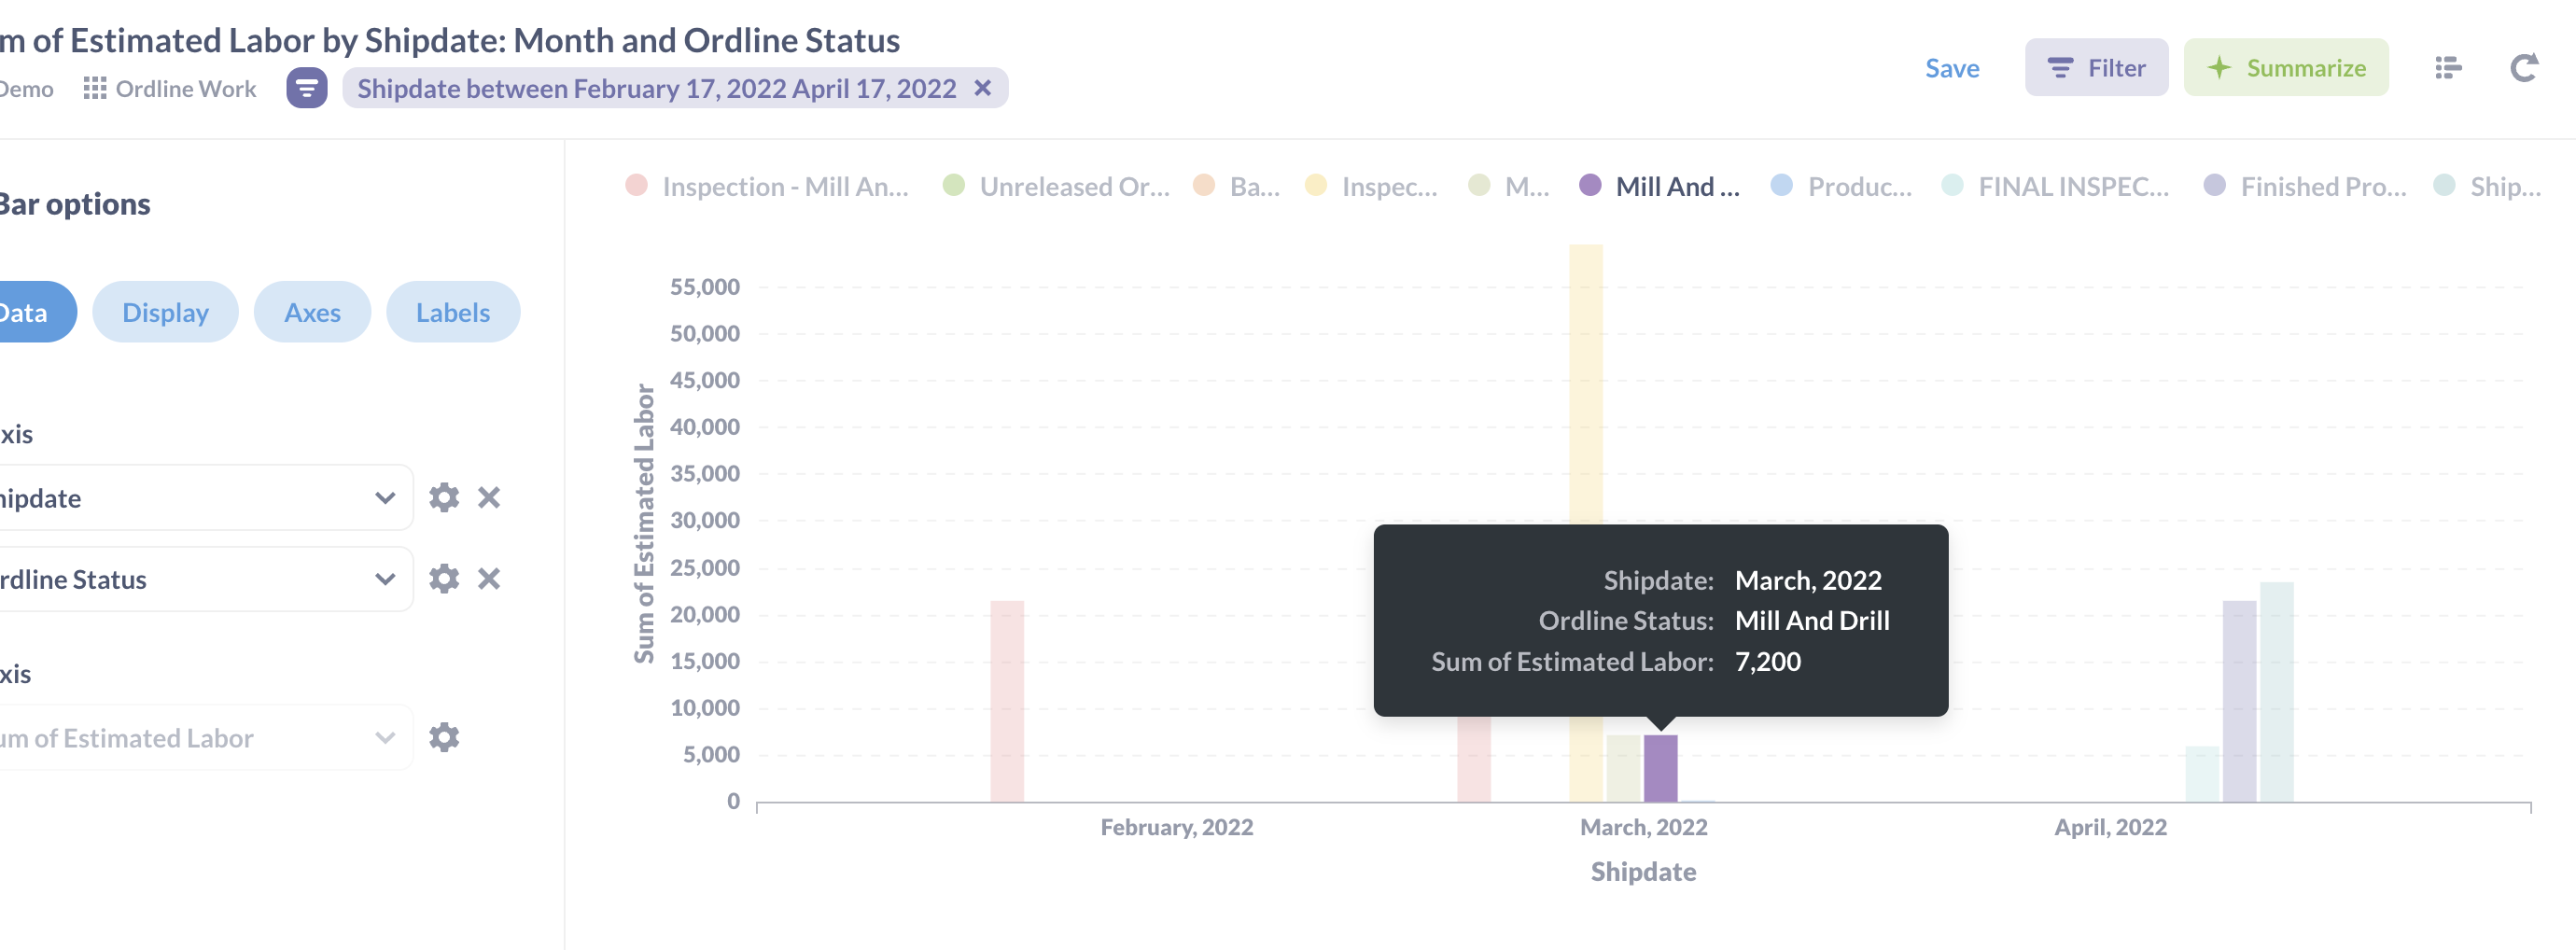
That would update the buckets into months, not weeks:
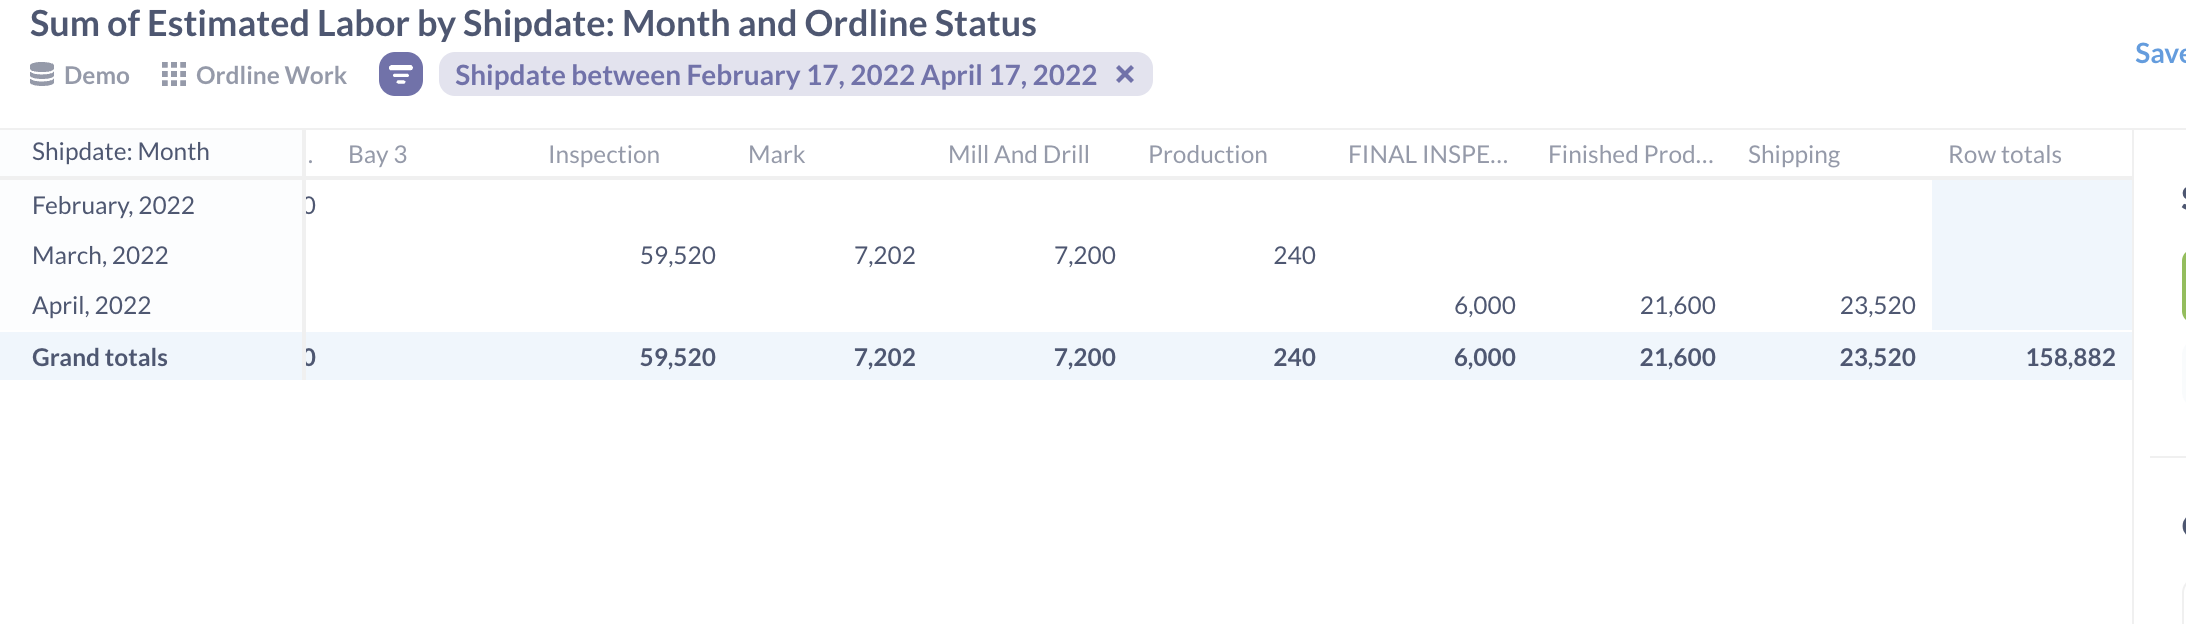
Then, you can say to the BI tool “turn this into a bar chart”:
Now let’s see what happens if we add each work location’s capacity as an additional dimension to the report:
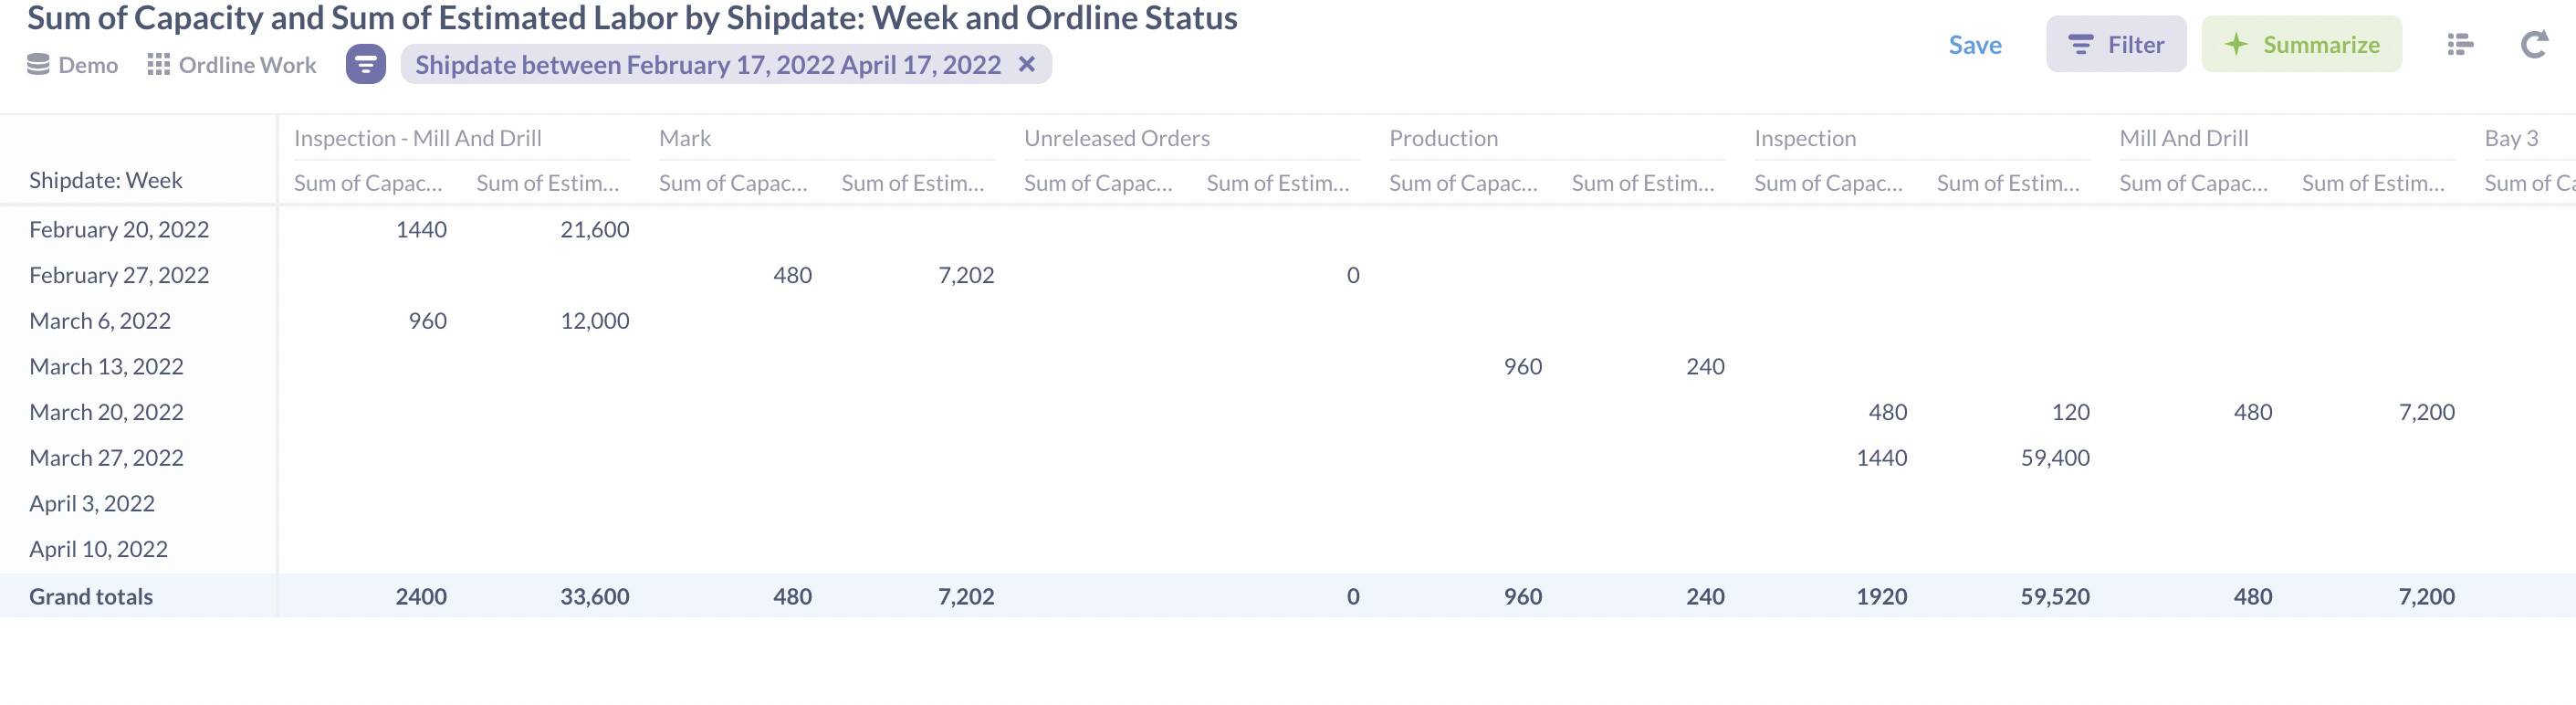
That report shows each work location, its demand labor, and its capacity, broken out by week (but this could be done by day as well). That starts to sound more like what you are asking about in your post above.
These reports… once they are built, they can then auto refresh, be added as KPIs to user specific or department specific dashboards, they can be set to auto email on a regular recurring frequency, they can be embedded in-app in the normal Cetec interface, sky’s the limit.
I’m not sure whether you are currently on a Cetec plan which provides access to the Cetec ERP BI reporting engine. If not, alternative it is possible Cetec ERP developers couldprovide a bid to develop a report included in the basic application that mirrors this capability. Please contact “sales@cetecerp.com” if you would be interested in something like that.
Thank you!
Thank you.
Back to the original questions… Can you help me understand this Order queue window? I’m not sure what the difference is between the “Current” orders at the top, and “Scheduled” orders at the bottom.
Also, the bar graph at the bottom looks super handy but it doesn’t show the used capacity which seems used if we look at the Gantt chart right above.

We also requested for a DEMO on the Cetec ERP BI and Jordan Jolly sent us a link to a video. We watched it but we would like a LIVE demo and ask some questions. Watching a video vs live demo is two different things.
Just wanted to make sure you got the email of introduction with one of our consultants who will be walking you through a Q&A of the Cetec ERP BI platform.
Thank you!
Back to the original questions… Can you help me understand this Order queue window? I’m not sure what the difference is between the “Current” orders at the top, and “Scheduled” orders at the bottom.
Also, the bar graph at the bottom looks super handy but it doesn’t show the used capacity which seems used if we look at the Gantt chart right above.
Yes, we did and no one has contacted us about demoing the software to us
This topic was automatically closed 90 days after the last reply. New replies are no longer allowed.