When I go to the supplier page, and click on Performance (ie. /vendor/3/grading) , The PO delivery performance chart and Inspection Pass/Fail Chart is not indicative of the specific vendor’s performance. It looks like it’s graphing all the vendors performance…I’m assuming the goal is to show the performance of the specific vendor on this page…
Hi, Regis,
When I checked the PO Delivery - Received vs Due Difference report with that vendor in the search (http://cetecerp.attolloengineering.com/purchaseorderreceipt/vendor_performance?vennum=Digi-Key+Electronics&from_date=2022-01-25&to_date=2022-01-28), I saw this:
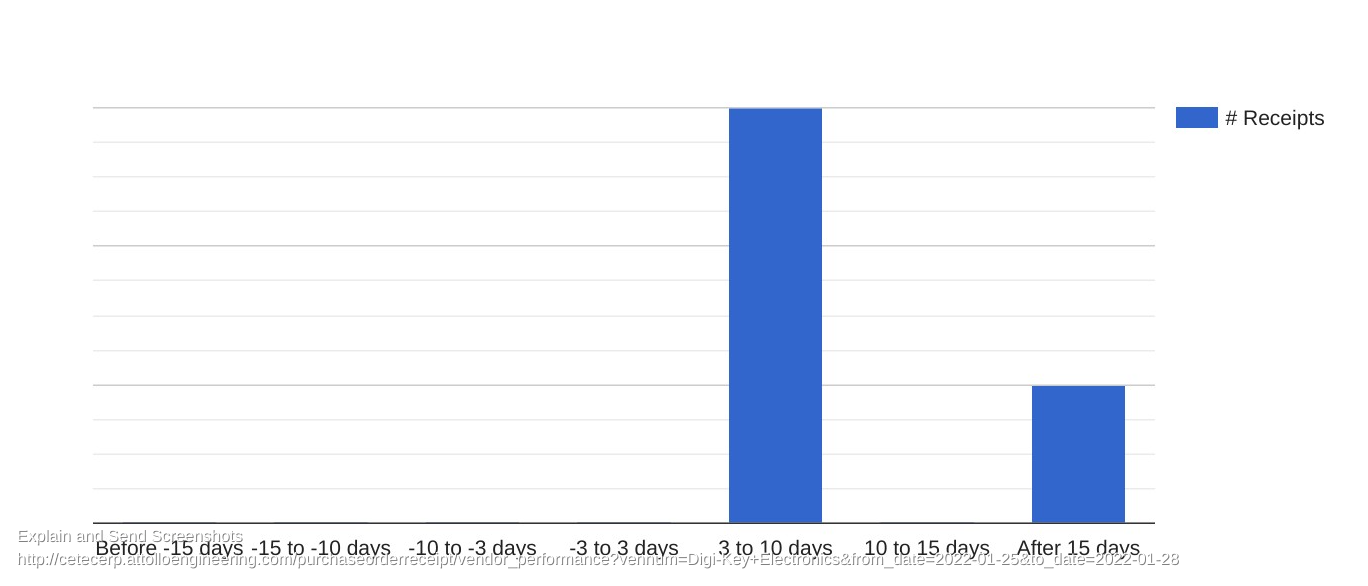
That matched the graph I saw on the link you sent over. Same thing happened when I searched for that vendor on the Incoming Inspections report (http://cetecerp.attolloengineering.com/incominginspection/list?reloaded=1&web_grid_page=1&inspection_date_from=2022-01-25&inspection_date_to=2022-01-28&prcpart=&status=&ponum=&vendor=Digi-Key+Electronics&location=).
Can you explain a bit more about the difference between the report and what you are expecting to see?
Thanks,
Cetec ERP Support